The speaker Collin Winter had this to say about it (starting 27:44 into the video).
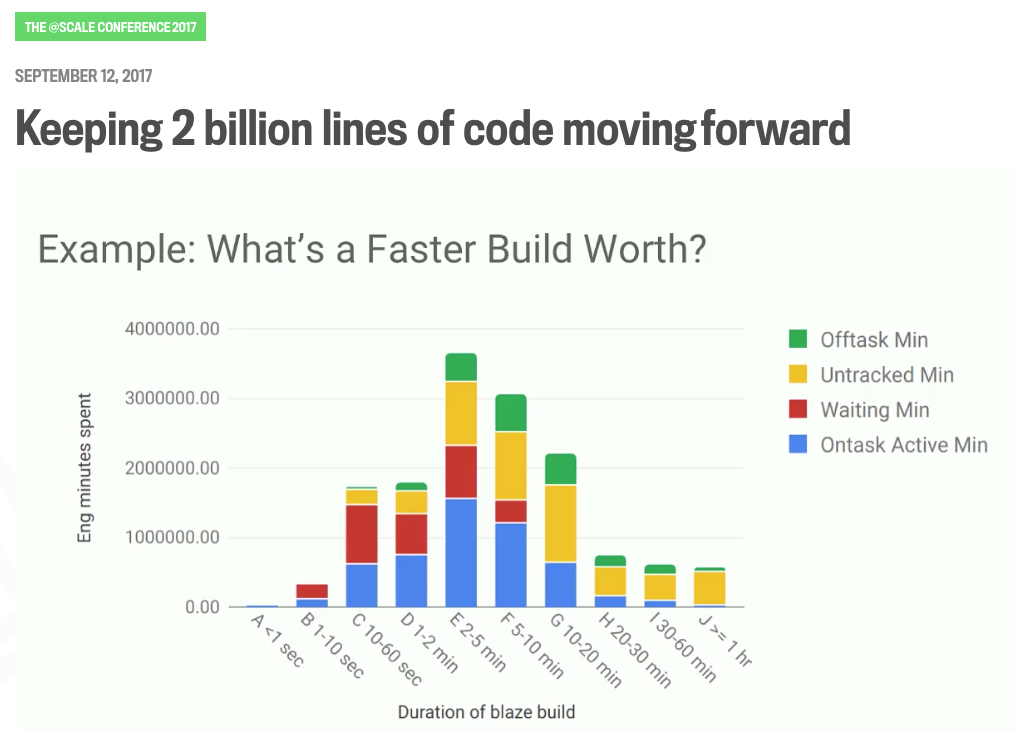
This is a graph from a report that we just published internally a few weeks ago that looks at, for builds of a different duration, how much time are people spending in each of these different cognitive modes. What we can see here is slow builds, builds lasting more than an hour, actually aren't taking that much time in aggregate. Likewise, builds that are really fast, well, they’re really fast, and they’re also not taking that much time in aggregate.
But we can see here that builds in the 2 to 5 minute range and the 5 to 10 minute range, those are actually pretty expensive. … That red bar is time where, as far as we can tell, people were just sitting there twiddling their thumbs staring at the terminal. … We can see time where we simply don’t know what they were doing [yellow].
It looks like the 2 to 10 minutes range is where we should spend our optimization effort and we can use that to focus our efforts more intelligently than a scattershot approach.
I'm of two minds here. Part of me is really interested in this data, but I'm also doubtful. They must be making some possibly large presumptions when interpreting the data of what counts as “untracked” vs. what's “waiting”. I'm also curious if this data is collected from their entire engineer population, or just volunteers? Do they know they're being tracked? How do they deal with the Heisenberg effect?
If the data is trustworthy, and I have a 15 minute build, will I make things worse by getting it into the 2-10 minute range? And how large does my engineering team need to be before any of this matters?